UML timing diagrams
State plotted against a real time axis. The interaction diagram to reach for when the deadline, the duration, or the overlap is the whole point.
6 min readUML 2.5.128 of 35
The short answer
- A sequence diagram's vertical axis is sequence, not time. A timing diagram's is real and scaled, which is why only one of them can say within 200 milliseconds.
- Reach for it when a deadline, a duration or an overlap between participants is the actual subject - embedded systems, protocols, anything with a timeout.
- A duration constraint bounds an interval; a time constraint bounds a single instant. Both are written in braces on the diagram.
- The waveform lifeline reads better with two or three states; the compact state-line form scales further.
01What it shows#
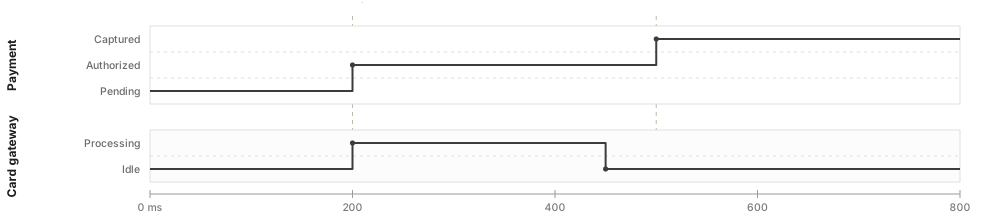
A timing diagram plots the state of one or more participants against time. Time runs left to right and, unlike every other UML diagram, it is to scale. Twice the distance means twice the duration.
That single property is the reason the diagram exists. A sequence diagram tells you a message happens after another one and says nothing about how long anything takes. If your question is "does this fit in the 300ms budget?" or "is the gateway still busy when the retry fires?", no amount of sequence diagram will answer it.
Each lifeline gets a band. Its possible states are listed down the left of that band, and a line steps between them, jumping vertically at each change and holding flat in between. Reading it is the same skill as reading a logic analyser trace or a chart of server state.
02The notation#
| Element | Notation | What it means |
|---|---|---|
| Lifeline | a horizontal band | One participant. Its name sits at the left; its states are the rows within the band. |
| State timeline | a stepped line | The value held over time. Vertical jumps are transitions; flat runs are the state being held. |
| Time axis | ruler along the bottom | Real, proportional time with units. This is what makes it a timing diagram. |
| Duration constraint | {0..300ms} between two marks | How long a span is allowed to take. The requirement, drawn. |
| Time constraint | {t..t+50ms} at a point | When an event must occur, relative to another. |
| Message | arrow between lanes | A communication from one lifeline to another, drawn at the instant it happens. |
03Constraints are the payload#
A timing diagram without constraints is a picture of what happened once. A timing diagram with them is a specification, and that is the version worth drawing.
A duration constraint spans two points and states how long the gap may be: {0..300ms} from request to response. A time constraint pins an event to a moment relative to another: {t..t+50ms}. Between them they express nearly every real-time requirement you are likely to have, and they express it in a form that a test can be written against directly.
The other thing to draw is overlap. Two lanes stacked vertically make it immediately obvious whether one participant is still busy when another expects it to be free - the class of bug that is nearly invisible in a sequence diagram and obvious here.
04When to draw one#
Reach for it when
- There is a latency budget, a timeout, or a deadline that the design must meet
- Embedded, protocol, or hardware-adjacent work where timing is the specification
- Diagnosing a race: two lanes make the overlap visible
- Explaining why a retry, a debounce, or a backoff behaves the way it does
Reach for something else when
- Ordering matters but duration does not - use a sequence diagram
- You are describing states and the events between them, not their timing - use a state machine
- There is no measured or specified timing to draw; a diagram with invented numbers is worse than none
- More than about four lifelines, in the plotted form
Timing diagrams are the rarest of the fourteen in ordinary business software, and indispensable in the domains that need them. If you work on embedded systems, network protocols, or anything with a hard real-time requirement, this is the diagram in which your requirements are most naturally written. If you do not, you may go a whole career without drawing one, and that is fine.
In one line each
- 01The only UML diagram whose axis is to scale: distance means duration.
- 02Each lifeline is a band; its states are rows, and a stepped line shows the value held.
- 03Duration and time constraints turn a recording into a specification.
- 04Stacked lanes make overlap - and therefore races - immediately visible.
- 05Use it when there is a real budget or deadline; otherwise a sequence diagram is the right tool.
05Common questions#
What is a UML timing diagram used for?
Showing how a participant's state changes against a real time axis. It is the interaction diagram to reach for when a deadline, a duration or an overlap between participants is the actual subject: embedded systems, protocols, and anything with a timeout in it.
What is the difference between a timing diagram and a sequence diagram?
A sequence diagram orders messages but says nothing about how long anything takes, because its vertical axis is sequence rather than time. A timing diagram has a real, scaled time axis, so it can express within 200 milliseconds and show two participants' states overlapping.
What is a duration constraint?
A marked interval on the diagram with a constraint on its length, written in braces. A time constraint is the same idea applied to a single instant rather than a span, as in this event must occur before five seconds have passed.
What are the two forms of a timing diagram lifeline?
The value-line form draws states as a waveform crossing between horizontal bands. The compact state-line form writes state names in a single band with transitions between them. The waveform is easier to read for two or three states; the compact form scales better.
In this series
- 01What is UML?
- 02UML symbols
- 03Choosing a diagram
- 04Class diagrams
- 05Class diagram examples
- 06How to draw a class diagram
- 07Class diagram symbols
- 08Sequence diagrams
- 09Sequence diagram examples
- 10How to draw a sequence diagram
- 11Use case diagrams
- 12Use case examples
- 13Activity diagrams
- 14Activity examples
- 15State machine diagrams
- 16State machine examples
- 17Component diagrams
- 18Component examples
- 19Drawing a component diagram
- 20Component symbols
- 21Deployment diagrams
- 22Deployment examples
- 23Object diagrams
- 24Package diagrams
- 25Composite structure diagrams
- 26Communication diagrams
- 27Sequence vs communication
- 28Timing diagrams
- 29Interaction overview diagrams
- 30Profile diagrams
- 31UML with AI
- 32E-commerce example
- 33Banking example
- 34Microservices example
- 35AWS example
Related reading
Behaviour diagrams
Behaviour diagrams
Foundations
Behaviour diagrams
Behaviour diagrams
Behaviour diagrams