Ejemplos de diagramas de despliegue
Tres diagramas de despliegue de sistemas que reconocerá - una aplicación web de tres capas, un clúster de Kubernetes y un pool tras un balanceador - cada uno con el razonamiento de qué se dibujó y qué se dejó fuera a propósito.
8 min de lecturaUML 2.5.122 de 35
La respuesta corta
- Cuatro nodos, tres caminos de comunicación etiquetados y tres flechas de despliegue son un diagrama completo: navegador, servidor web, servidor de aplicaciones, base de datos.
- Un contenedor en ejecución es un entorno de ejecución y por tanto un nodo. La imagen de la que arrancó es un artefacto: dibujarla como nodo es el error habitual.
- Muestra la redundancia con una multiplicidad como 3..* en un nodo. Un diagrama que afirma exactamente tres instancias es falso tras el primer autoescalado.
- Dibuja solo lo necesario para responder a la pregunta que te hizo dibujarlo. Cada nodo extra es una afirmación que alguien deberá mantener cierta tras la próxima migración.

01Ejemplo 1: una aplicación web de tres capas#
El diagrama de arriba es el que merece la pena saber dibujar de memoria. Un navegador, un servidor web que termina el TLS, un servidor de aplicaciones, una base de datos. Tres rutas de comunicación que llevan el protocolo y el puerto, y tres artefactos colocados sobre los nodos que los ejecutan.
Dos decisiones suyas merecen nombrarse. Primera, las etiquetas de protocolo son la razón de que el diagrama sea útil: HTTPS, HTTP/8080, TCP/5432 es todo el contenido de la mayoría de las revisiones de seguridad, y un diagrama sin ellas son cuatro cajas que cualquiera podría haber adivinado. Segunda, los artefactos son nombres de fichero reales - orders.jar, no «aplicación» - porque un diagrama de despliegue va de cosas físicas, y una construcción produce ficheros con nombre.
02Ejemplo 2: un clúster de Kubernetes#
Los contenedores hacen dudar a la gente, porque un contenedor es a la vez algo que se ejecuta y algo que se construyó. UML ya separa las dos cosas: el contenedor en ejecución es un entorno de ejecución, que es un nodo, y la imagen de la que arrancó es un artefacto, que se despliega sobre él.

Nada en la forma de este diagrama se diferencia del de tres capas, y de eso se trata: ha cambiado el entorno de ejecución y la notación no. El balanceador es un «device» porque es infraestructura en la que no despliegas. El controlador de ingress y el pod son «execution environment» porque dentro de ellos corren otras cosas. La etiqueta de imagen orders:1.4.2es un artefacto porque la produjo una construcción, y poner la versión en la etiqueta es lo que hace que el diagrama responda a «qué está corriendo en producción ahora mismo».
La base de datos gestionada se sitúa en el borde como un dispositivo simple. Ese es el dibujo honesto: no despliegas artefactos sobre un servicio que opera otro, y fingir que el esquema está instalado «en RDS» solo es cierto en el sentido de que allí se aplicó una vez.
03Ejemplo 3: un grupo tras un balanceador#
La razón más común por la que alguien abre un diagrama de despliegue es averiguar qué pasa cuando muere una caja. Esa pregunta tiene una forma, y merece dibujarse explícitamente en vez de dejarla a una nota al pie.
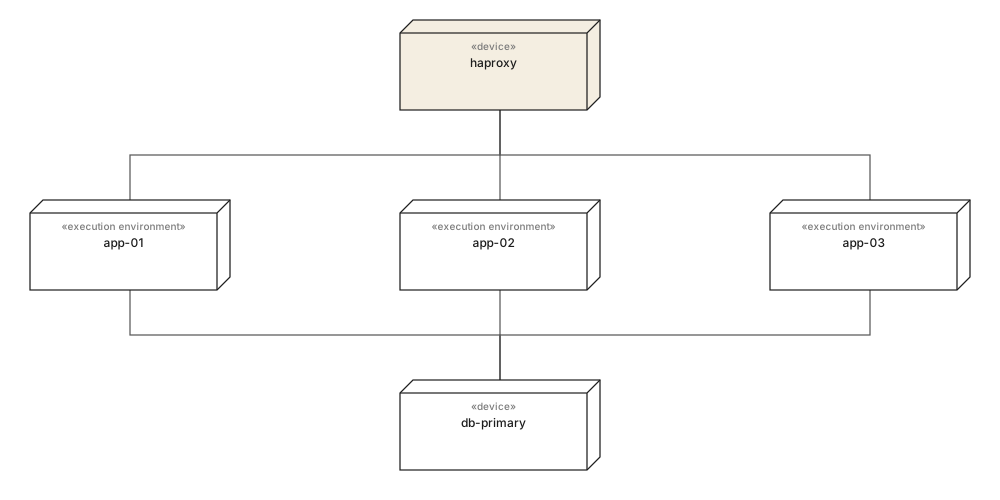
Tres nodos de aplicación tras un balanceador, todos escribiendo en una única primaria. Dibujado así, el punto único de fallo se ve sin que nadie tenga que decirlo: la capa de aplicación se abre en abanico y la de datos no. Esa es una frase sobre la que alguien actuará, y no ha costado notación adicional.
Cuando el número varía en ejecución, sustituye los tres nodos por uno que lleve una multiplicidad - app-node [3..*] - en vez de dibujar una cantidad arbitraria. Un diagrama que afirma exactamente tres es falso la primera vez que el grupo escala, y un diagrama que se sabe falso deja de consultarse.
04Qué dejar fuera#
Todo diagrama de despliegue que se vuelve inútil lo hace de la misma manera: alguien siguió añadiendo nodos. La disciplina está en decidir para qué es el diagrama antes de que caiga la segunda caja.
Úsalo cuando
- Protocolos y puertos en cada ruta de comunicación: es el contenido de la mayoría de las revisiones.
- Nombres de artefacto reales con versiones, para que el diagrama responda qué está corriendo ahora.
- Una instancia representativa por rol, con multiplicidad cuando el número varía.
- Servicios gestionados como dispositivos simples en el borde, con la frontera de lo que operas a la vista.
Usa otra cosa cuando
- Capas lógicas: no tienen dirección y no se despliega nada en ellas.
- Cada microservicio de un parque grande. Dibuja mejor un subsistema por diagrama.
- Monitorización, registro y agentes de integración continua, salvo que el diagrama vaya de ellos.
- Recuentos de instancias en vivo, que ya están mal cuando se revisa el diagrama.
Si necesitas la contraparte que muestra el software en vez de las máquinas, eso es un diagrama de componentes. Los dos suelen dibujarse en pareja, y el de despliegue es el más corto.
05Qué recordar#
En una línea cada uno
- 01Cuatro nodos, protocolos etiquetados y artefactos con nombre ya son un diagrama de despliegue completo.
- 02Un contenedor en ejecución es un nodo; la imagen de la que arrancó es un artefacto. Confundirlos es el error habitual con contenedores.
- 03Las etiquetas de protocolo y puerto son lo que hace que el diagrama merezca abrirse en una revisión.
- 04Dibuja una instancia por rol y usa una multiplicidad cuando el número varíe en ejecución.
- 05Si a una caja no se le puede hacer ping, no pertenece a este diagrama.
06Preguntas frecuentes#
¿Cuál es un ejemplo sencillo de diagrama de despliegue?
Un navegador que se conecta a un servidor web, este a un servidor de aplicaciones y este a una base de datos, con un artefacto desplegado en cada uno. Cuatro nodos, tres caminos de comunicación etiquetados con su protocolo y tres flechas de despliegue forman un diagrama completo y útil.
¿Cómo se dibuja un diagrama de despliegue para Kubernetes?
Modele las piezas de ejecución del clúster como nodos y las imágenes como artefactos. El balanceador es un dispositivo, el controlador de ingress y cada pod son entornos de ejecución, y la imagen del contenedor es un artefacto desplegado en el pod. Los servicios gestionados siguen siendo dispositivos en el borde.
¿Los contenedores son nodos o artefactos en UML?
Ambos, según a qué contenedor se refiera. Un contenedor en ejecución es un entorno de ejecución y por tanto un nodo, porque dentro corre otra cosa. La imagen de la que arrancó es un artefacto, porque es un archivo producido por una compilación. Dibujar la imagen como nodo es el error más común.
¿Cómo se muestra la redundancia en un diagrama de despliegue?
O dibuja las instancias, que es honesto pero no aguanta más de cuatro, o dibuja un nodo con una multiplicidad en la esquina, por ejemplo app-node con 3..*. Use lo segundo cuando el número varíe en ejecución: un diagrama que afirma exactamente tres es falso tras el primer autoescalado.
¿Cuánto detalle debe llevar un diagrama de despliegue?
El suficiente para responder a la pregunta que le hizo dibujarlo. Una revisión de infraestructura quiere protocolos y puertos en los caminos de comunicación; un diagrama de incorporación quiere cuatro cajas y nada más. Cada nodo extra es una afirmación que alguien deberá mantener cierta tras la próxima migración.
En esta serie
- 01¿Qué es UML?
- 02Símbolos UML
- 03Elegir un diagrama
- 04Diagramas de clases
- 05Ejemplos de diagramas de clases
- 06Cómo dibujar un diagrama de clases
- 07Símbolos del diagrama de clases
- 08Diagramas de secuencia
- 09Ejemplos de diagramas de secuencia
- 10Cómo dibujar un diagrama de secuencia
- 11Diagramas de casos de uso
- 12Ejemplos de casos de uso
- 13Diagramas de actividad
- 14Ejemplos de actividad
- 15Diagramas de máquina de estados
- 16Ejemplos de máquina de estados
- 17Diagramas de componentes
- 18Ejemplos de componentes
- 19Dibujar un diagrama de componentes
- 20Símbolos de componentes
- 21Diagramas de despliegue
- 22Ejemplos de despliegue
- 23Diagramas de objetos
- 24Diagramas de paquetes
- 25Diagramas de estructura compuesta
- 26Diagramas de comunicación
- 27Secuencia vs comunicación
- 28Diagramas de tiempos
- 29Diagramas de visión general de interacción
- 30Diagramas de perfil
- 31UML con IA
- 32Ejemplo de e-commerce
- 33Ejemplo bancario
- 34Ejemplo de microservicios
- 35Ejemplo de AWS
Lecturas relacionadas
Diagramas de estructura
Diagramas de estructura
Diagramas de estructura
Práctica del modelado
Diagramas de estructura
Diagramas de estructura